Houdini Crashes With No Error Message: Reading Exit Codes and Logs
Houdini vanishing without a single error message is hands-down every 3D artist’s worst nightmare. One second you’re baking a heavy simulation, and the next, your workspace simply disappears—leaving you with a blank screen, zero saved progress, and a lot of frustration. If your viewport shuts down instantly or throws an Exit Code error during a Karma GPU render, don’t panic. This isn’t random magic, it’s a classic segmentation fault triggered when Houdini pushes your system memory past its absolute limit. Stop guessing and trying random fixes.
In this guide, iRender will show you how to find the hidden clues in your logs, see what caused the problem, and stop these crashes for good.
Houdini Vanished with No Error: Now What?
When the operating system forcefully terminates an application due to memory exhaustion or critical hardware timeouts, Houdini gets wiped from memory before it even gets a chance to build a crash dialog.
To pinpoint what happened, check these four places:
- Command Line (Terminal / Command Prompt): Keeps the final output logs visible after the main GUI closes.
- System Resource Monitors (Task Manager / Activity Monitor): Shows the exact memory and VRAM history leading up to the crash.
- Event Viewer (Windows) or dmesg / syslog (Linux): OS-level system logs that capture hardware events and driver resets.
- Exit Codes: Numerical status values returned by the operating system when a process terminates.
Run it from the command line to keep the log
Launching Houdini from a shortcut icon means the command window closes the second Houdini crashes, taking all the error text with it.
To keep those error messages on screen, open Houdini directly from the Command Prompt (Windows) or Terminal (Mac/Linux):
- Open Command Prompt or Terminal.
- Type the full path to Houdini (for example, on Windows: “C:\Program Files\Side Effects Software\Houdini 20.0.xxx\bin\houdini.exe”).
- Press Enter to run the app.
When Houdini closes unexpectedly, the command window will stay open. Scroll up to check the last few lines. If you see words like Out of Memory, Segmentation Fault, or Cache Purge, you have found the reason for the crash.
Watch Your Memory Usage
Do not wait for a crash to start checking your computer. Open Task Manager (Ctrl + Shift + Esc on Windows), go to the Performance tab, click Memory, and keep it visible next to Houdini while you simulate or render.
- RAM Running Out: The RAM graph goes up fast, hits 95% to 99%, holds for a few seconds, and then Houdini shuts down.
- Virtual Memory (Pagefile): Even if your main RAM is not completely full, a full virtual memory (pagefile) on Windows will cause the operating system to close Houdini to protect your computer.
If the memory bar hits the top right before Houdini closes, your computer simply runs out of memory.
Exit Codes and What They Hint At
When a program closes abruptly, it leaves behind an exit code. While it won’t point to the exact line of code that failed, it narrows down your diagnostic focus.
On Linux systems, exit code 139 is particularly common. This indicates a Segmentation Fault meaning the application tried to access a memory location it wasn’t allowed to. In heavy Houdini tasks, a frequent cause behind exit code 139 is the Linux Out-Of-Memory (OOM) Killer stepping in to terminate Houdini before the entire system freezes.
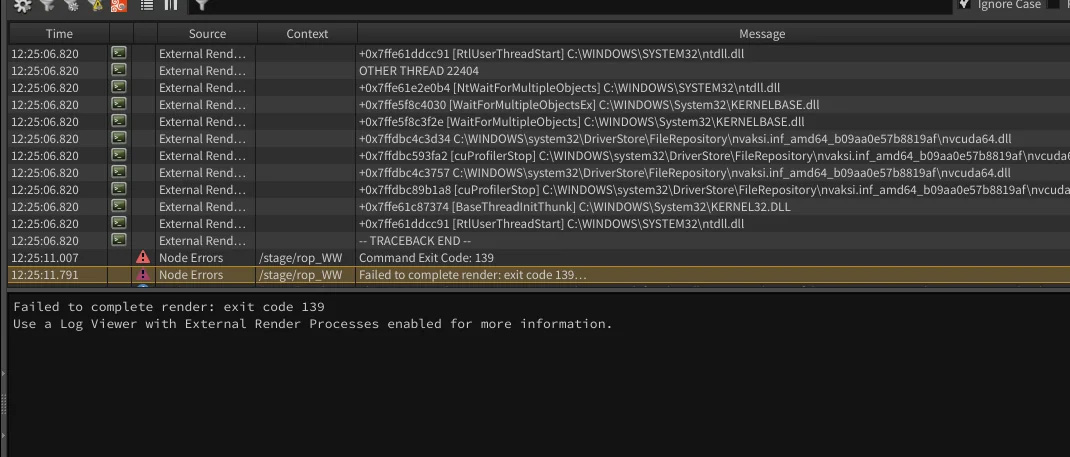
On Windows, running out of memory often gives codes like 0xC0000005 or Exit Code 1, which means Houdini lost access to system memory.
Never rely on the number alone. An exit code shows how Houdini closed, not why it happened. Always check the number alongside your Task Manager RAM graph and system logs at the exact time of the crash to make sure your diagnosis is correct.
Telling apart the three failure types
Fixing a crash becomes much easier once you know what type of failure actually happened. Treating a memory issue like a GPU driver crash wastes valuable time because each problem needs a totally different fix. Check this quick reference table to diagnose your scene:
| Symptoms | Likely Cause | Where to Look | Fix Action |
| App vanishes instantly, RAM hits 100% | Out of Memory (RAM) | Task Manager / Terminal | Cache to disk or lower sim scale |
| Screen flickers, “Display driver recovered” | GPU Driver / TDR | Windows Event Viewer | Update drivers or adjust TDR delay |
| Viewport freezes, CPU/RAM stays high | Heavy Processing (Not a crash) | Task Manager | Wait for it or press Esc |
| Viewport freezes, CPU/GPU drops to 0% | Hard Freeze / Deadlock | Terminal / Event Viewer | Force close and check custom HDAs |
From diagnosis to fix
Once you know what caused the crash, choosing the right fix becomes straightforward:
- If the problem is software-related (corrupt HDA, broken node, or scene file bug): Renting a faster machine or adding more hardware will not solve anything. The scene will still crash on a supercomputer if the underlying data is broken. Clean up your scene first, test nodes individually, or copy your assets into a fresh, empty file to isolate the bad element.
- If the problem is pure hardware limits (your scene needs more RAM or GPU power than your local PC has): This is where upgrading your environment makes sense. Instead of spending thousands of dollars on physical hardware upgrades, shifting your heavy tasks to a high-spec remote cloud machine is the fastest, most cost-effective path forward.
This is exactly where iRender fits into your pipeline.
How iRender handles demanding Houdini workloads
By offering an IaaS (Infrastructure as a Service) setup, iRender gives you full remote control over powerful Windows or Linux cloud workstations. These machines feature top-tier specs, including AMD Threadripper Pro processors, up to 256GB of system RAM, and multi-GPU setups featuring RTX 4090s and the latest RTX 5090 GPUs (with a massive 32GB VRAM each). Let’s see the configuration below:
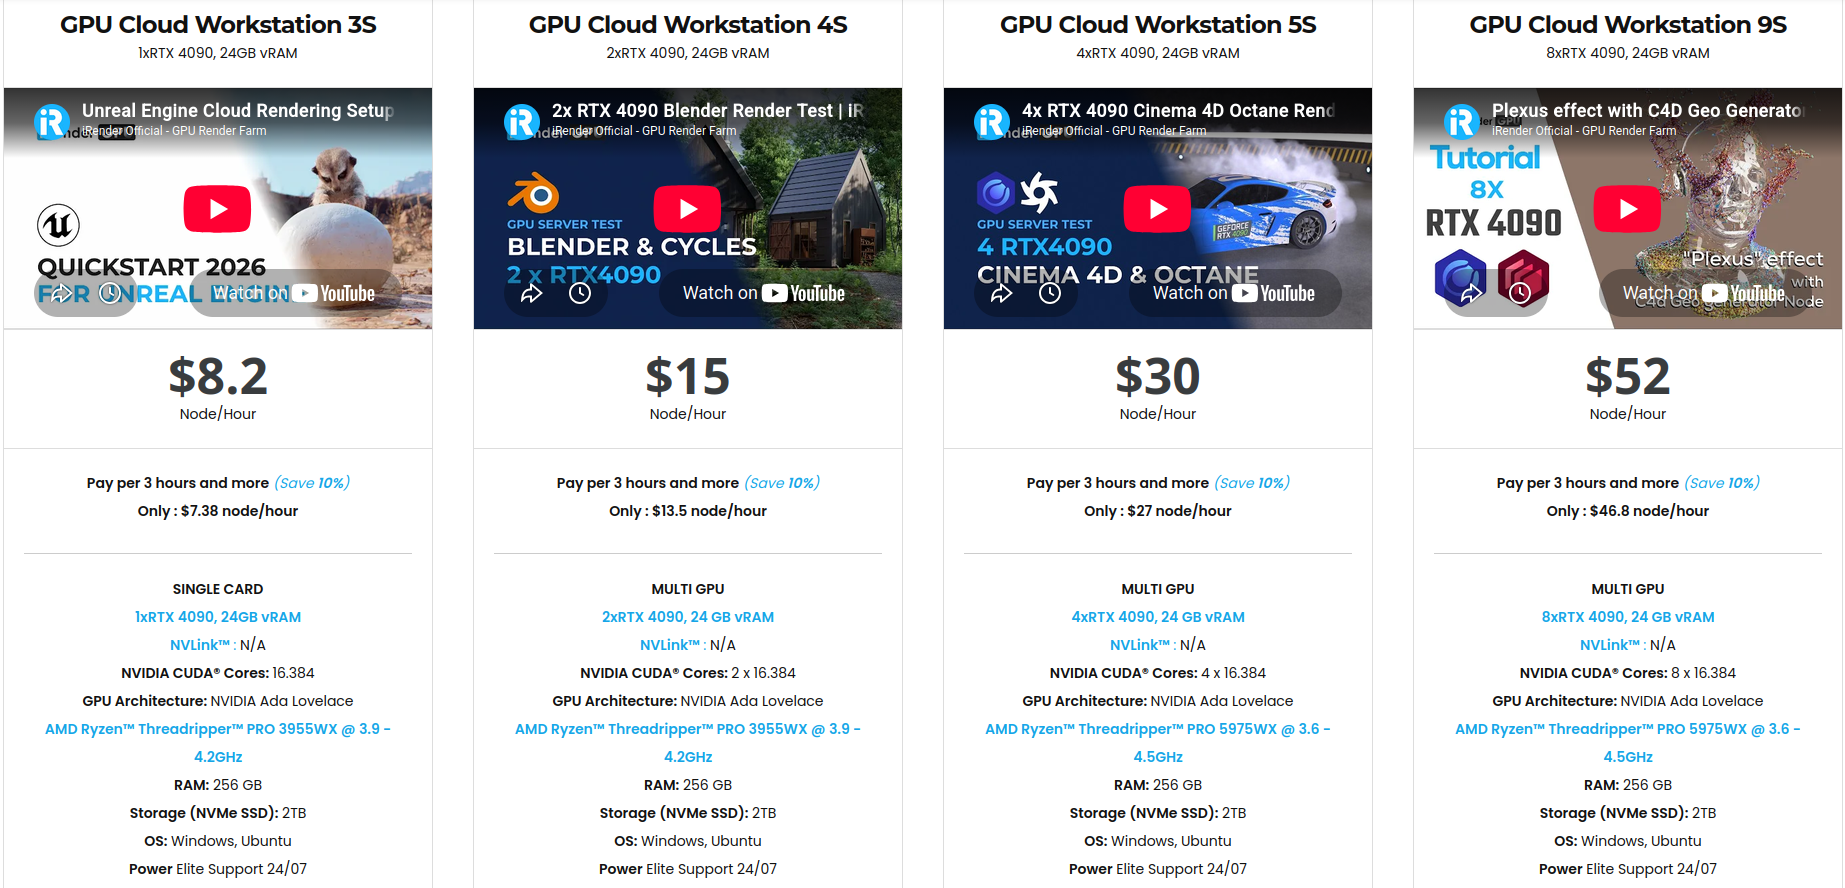
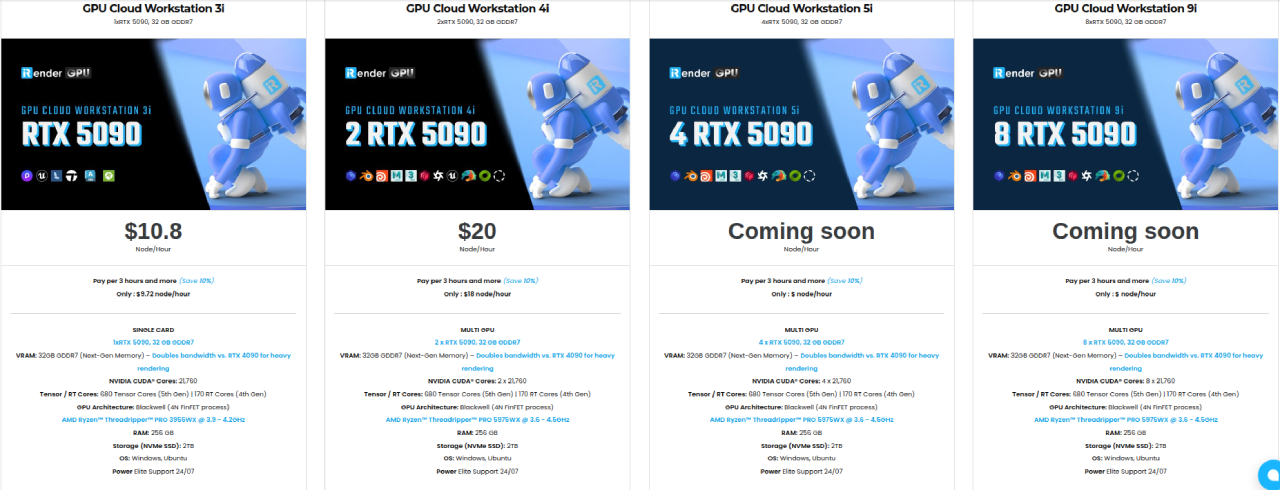
Because you get complete admin access to a desktop environment, you can install your exact Houdini build, load custom HDAs, and set up your pipeline tools just like on your local computer. To save even more time, iRender also provides pre-configured Houdini templates, allowing you to launch an environment with Houdini already set up and get straight to work.
Register today to take advantage of a 100% bonus on your very first deposit!
Let’s watch the tutorial video to see how our service works:

FAQ
- Can I find out why Houdini closed with no error message?
Re-launch Houdini from the command line so the console stays open after a crash, and keep Task Manager open to track RAM usage in real time. If system memory spikes to 100 percent right before the app disappears, it is almost certainly an out-of-memory crash. On Windows, you can also inspect the Event Viewer for logged application failures.
2. What does exit code 139 mean in Houdini?
On Linux, exit code 139 points to a segmentation fault, which is frequently triggered when the system terminates a process that has run out of memory. Rather than relying solely on the code, cross-reference it with your RAM usage logs and system logs at the exact moment of failure before troubleshooting.
3. How do I tell a memory crash from a GPU driver crash in Houdini?
An out-of-memory crash usually causes Houdini to instantly vanish without warning right as your system RAM or VRAM hits its limit. In contrast, a GPU driver crash during rendering often triggers a brief screen flicker, leaves a driver recovery warning, and logs a display or TDR error in the Windows Event Viewer.
Maximum Speed – Absolute Freedom
Related Posts
The latest creative news from Houdini Cloud Rendering , 3D VFX Plugins & Cloud Rendering.